Sun
- Sunrise
- 6:49 AM
- Sunset
- 4:36 PM
- First light
- 6:19 AM
- Last light
- 5:05 PM
Reservoir · Morris County, New Jersey
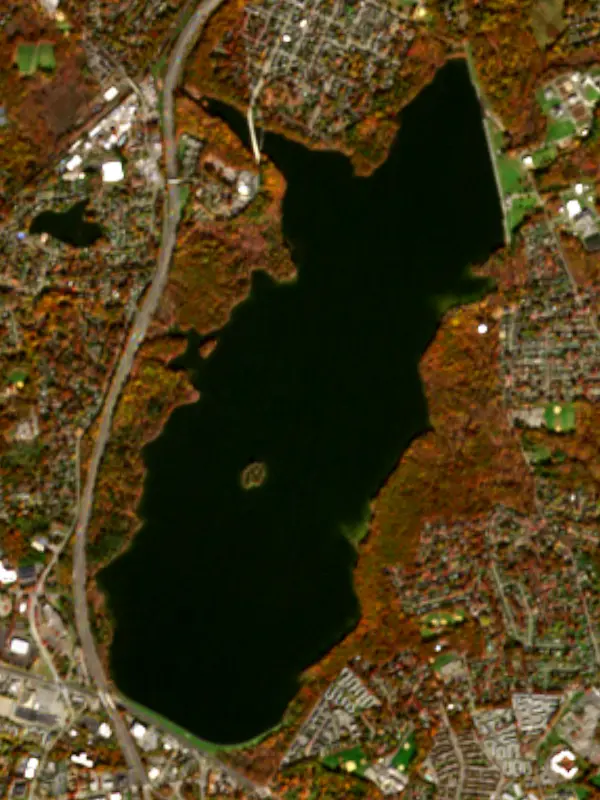
A reservoir on the Rockaway River in Morris County, New Jersey, held back by Boonton Dam since 1905.

Boonton Reservoir is at 305.48 feet above sea level — 0.23 ft above spillway crest (full pool), as of Nov 19, 2026, 5:00 AM EST. It has risen 0.45 ft in the past 7 days.
Fullest of 4 New Jersey lakes today against full pool · See the ranking
A notification from this browser, once, when the level crosses the line (checked every hour). No account and no email. On an iPhone, add Lake by Lake to your home screen first (Share → Add to Home Screen) and open it from there. Or follow the lake in a feed reader: RSS feed.
Boonton Reservoir is up 0.45 ft over the last 7 days, at 305.48 ft today.
Daily values from the U.S. Geological Survey.
Boonton Reservoir has held steady over the last 30 days (within 0.05 ft).
Daily values from the U.S. Geological Survey.
Over the past 12 months, Boonton Reservoir ranged from 290.19 ft (Dec 19, 2025) to 306.20 ft (Aug 7, 2026), a swing of 16.0 ft. Today's level is near the top of that range. It is 14.65 ft higher than on this date last year.
Daily values from the U.S. Geological Survey. Why lake levels rise and fall
Solunar periods for Boonton Reservoir, local time. How they work
Not detected · as of Nov 9, 2026
The satellite found no cyanobacteria at the surface.
Week of Aug 9Week of Nov 1
Each bar is one week, colored by the worst reading of that week.
From the U.S. EPA's Cyanobacteria Assessment Network (CyAN), which reads the color of lakes from the Sentinel-3 satellites; it sees open water only, not coves or the shoreline. Blooms can be patchy: what you see on the water matters more. Swimming closures and health advisories come from New Jersey health and environment agencies. How to read it
Surface water temperature
59°F on Oct 27, 2026
79°F · Jul 2359°F · Oct 27
19°F cooler than on Jul 23, 2026.
Estimated from Landsat 8/9 (USGS) passes on clear days: the top layer of the water, a few degrees either way. Coves and the shallows can be warmer.
Boonton Reservoir water temperature: trend, swimming and the fish →
Tap an icon for details; use two fingers (or Ctrl + scroll) to move the map. Tap a dot for details. Map and lake outline © OpenStreetMap contributors. Places from OpenStreetMap, Overture Maps and Recreation.gov. Not for navigation.
No aquatic invasive species are on record for Boonton Reservoir in the USGS database. Keep it that way: clean, drain and dry your boat between lakes.
New Jersey: New Jersey has no clean-drain-dry law for boaters. The state urges you to remove plants from the boat, motor and trailer, drain livewells, bilge and bait tanks before leaving, and let gear dry before the next water. State rules
Records: USGS Nonindigenous Aquatic Species database. A species not listed may still be present.
The Boonton Reservoir is a 700-acre (280 ha) reservoir located between Boonton and Parsippany–Troy Hills, New Jersey. Boonton, along with nearby Splitrock Reservoir, provides water for Jersey City, New Jersey. It was formed by the construction of a dam on the Rockaway River completed in 1904 on the site of the original town of Boonton.
From Wikipedia, under CC BY-SA 4.0.
Boonton Dam is a masonry dam 120 feet high and 2,150 feet long on the Rockaway River, completed in 1905. It belongs to Jersey City Municipal Utilities Authority and is run for water supply. At its normal level the reservoir holds 28,000 acre-ft, drained from 119 square miles of land.
From the National Inventory of Dams (U.S. Army Corps of Engineers), NID ID NJ00354. Lake or reservoir: what’s the difference?
Where the level comes from: Boonton Reservoir at Boonton NJ (U.S. Geological Survey).
| Lake | Miles | Level (ft) | vs full | 7 days |
|---|---|---|---|---|
| Wanaque Reservoir Below full | 12 | 290.03 | −12.37 | +1.04 |
| Lake Hopatcong Live reading | 14 | 923.48 | — | 0.00 |
| Greenwood Lake Live reading | 19 | 618.50 | — | +0.07 |
| Oradell Reservoir Slightly below full | 20 | 19.33 | −3.83 | −0.02 |
| Woodcliff Lake Live reading | 20 | 91.12 | — | +0.28 |
| Lake Tappan Live reading | 22 | 54.75 | — | +0.21 |
Compare Boonton Reservoir with Wanaque Reservoir, Lake Hopatcong, Greenwood Lake or Oradell Reservoir: size, level, ramps and fish side by side.
Boonton Reservoir is about 12 mi from Paterson, NJ, 17 mi from Newark, NJ and 19 mi from Elizabeth, NJ. See all the lakes near each city.
Boonton Reservoir is at 305.48 feet above sea level — 0.23 ft above spillway crest (full pool), as of Nov 19, 2026, 5:00 AM EST. It has risen 0.45 ft in the past 7 days.
Boonton Reservoir's spillway crest (full pool) is 305.25 ft, according to U.S. Geological Survey. Today the lake is 0.23 ft above that mark.
Today's level is 5.73 ft above the median for this date (299.75 ft), from the gauge’s long-term daily record.
Anglers 16 and older need a New Jersey fishing license, sold online by the New Jersey Division of Fish and Wildlife. Free fishing days: Two days a year for New Jersey residents (2026: June 6 and September 26). Size and bag limits can be set lake by lake: check the current regulations.
Boonton Reservoir averages about 35 ft deep. Depth changes with the lake level.
cabins & lodging (7 places to stay close to the water), parks & picnics (1 park on the shore) and waterfront dining (2 waterfront restaurants), according to our map of the shore.
EPA's CyAN satellite rated cyanobacteria in Boonton Reservoir not detected on November 9. The satellite sees open water only; blooms can be patchy, so avoid water that looks like spilled paint or pea soup and keep dogs out of scum. Swimming advisories come from New Jersey health and environment agencies.
Boonton Reservoir is held back by Boonton Dam, completed in 1905 and 120 ft high, according to the National Inventory of Dams.
From the U.S. Geological Survey (Boonton Reservoir at Boonton NJ). Lake by Lake checks it every hour; the agency's own figure is always the reference, and provisional readings can be revised.
Lake levels are refreshed every hour. Texas and California reservoirs report once a day; most USGS and NOAA gauges report every 15 to 60 minutes.
Cookies for analytics With your OK we use Google Analytics and Microsoft Clarity to count visits and see how the site is used, so we can make it better. No advertising cookies. Privacy policy