Sun
- Sunrise
- 7:15 AM
- Sunset
- 5:05 PM
- First light
- 6:45 AM
- Last light
- 5:34 PM
Reservoir · Harrison County, Ohio
A reservoir on Stillwater Creek in Harrison County, Ohio, held back by Piedmont Dam since 1937.
Piedmont Lake is at 911.03 feet above sea level — 1.97 ft below full summer pool, as of Nov 19, 2026, 1:15 AM EST. It has dropped 0.88 ft in the past 7 days.
13th fullest of 27 Ohio lakes today against full pool · See the ranking
Record low 904.89 ft (2026), record high 919.86 ft (2024) · Level history since 2017
A notification from this browser, once, when the level crosses the line (checked every hour). No account and no email. On an iPhone, add Lake by Lake to your home screen first (Share → Add to Home Screen) and open it from there. Or follow the lake in a feed reader: RSS feed.
Piedmont Lake is down 0.88 ft over the last 7 days, at 911.03 ft today.
Daily values from the U.S. Geological Survey.
Piedmont Lake is down 2.21 ft over the last 30 days, at 911.03 ft today.
Daily values from the U.S. Geological Survey.
Over the past 12 months, Piedmont Lake ranged from 904.89 ft (Feb 2, 2026) to 915.78 ft (Mar 30, 2026), a swing of 10.9 ft. Today's level is in the upper half of that range. It is 2.72 ft higher than on this date last year.
Daily values from the U.S. Geological Survey. Why lake levels rise and fall
In the U.S. Geological Survey record, which starts in 2017, the lowest level was 904.89 ft on February 2, 2026 and the highest 919.86 ft on April 14, 2024. Today’s 911.03 ft is 6.1 ft above the record low and 8.8 ft below the record high.
Piedmont Lake level history: every year since 2017, the lowest and highest years →
Solunar periods for Piedmont Lake, local time. How they work
Moderate · as of Nov 9, 2026
A bloom may be forming somewhere on the lake. Avoid water that looks like spilled paint or pea soup. About 249,000 cells/mL at the worst spot, covering 1% of the lake.
Week of Aug 9Week of Nov 1
Each bar is one week, colored by the worst reading of that week.
From the U.S. EPA's Cyanobacteria Assessment Network (CyAN), which reads the color of lakes from the Sentinel-3 satellites; it sees open water only, not coves or the shoreline. Blooms can be patchy: what you see on the water matters more. Swimming closures and health advisories come from Ohio health and environment agencies. How to read it
Surface water temperature
63°F on Oct 23, 2026
80°F · Sep 1363°F · Oct 23
18°F cooler than on Sep 13, 2026.
Estimated from Landsat 8/9 (USGS) passes on clear days: the top layer of the water, a few degrees either way. Coves and the shallows can be warmer.
Piedmont Lake water temperature: trend, swimming and the fish →
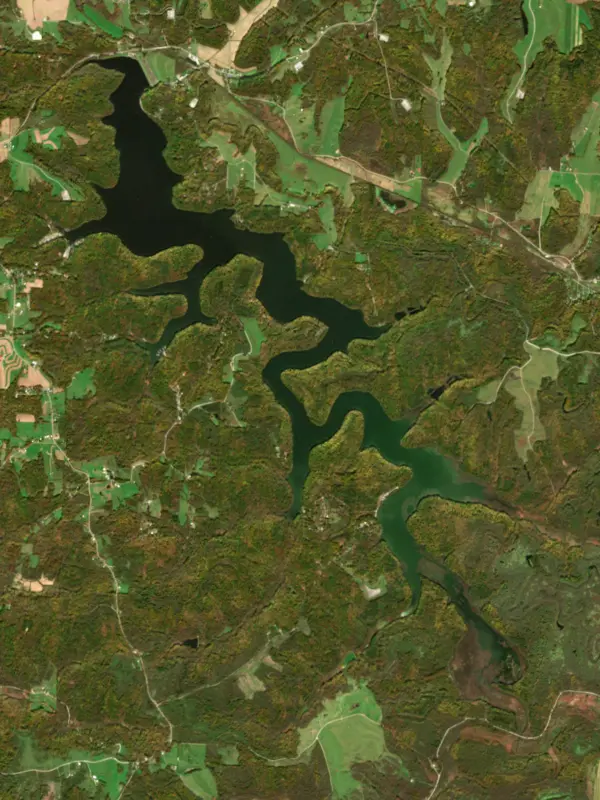
On or near the shore of Piedmont Lake: 4 boat ramps, 2 marinas, 1 rental outfit, 2 campgrounds and 2 trails. The lake has about 36 miles of shoreline, counting its islands.
Tap an icon for details; use two fingers (or Ctrl + scroll) to move the map. Tap a dot for details. Map and lake outline © OpenStreetMap contributors. Places from OpenStreetMap, Overture Maps and Recreation.gov. Not for navigation.
Zebra mussels have been found in Piedmont Lake. They clog intakes and engines and spread on boats and trailers: clean, drain and dry everything before you go to another lake.
Ohio: Ohio has no clean-drain-dry law for boaters; ODNR asks you to clean, drain and dry your boat before leaving every lake and to put unused bait in the trash. Possessing, selling or releasing listed injurious invasive species such as round goby is illegal. State rules
Records: USGS Nonindigenous Aquatic Species database. A species not listed may still be present.
Species with open-licensed records inside Piedmont Lake's outline, from GBIF.org (surveys, museum collections and angler reports). A record shows a fish was found here, not how many there are now.
Shallow, muddy bays and flooded grass in spring; mud flats and inflows in summer.
Water temperature sets off each spawn; the bars show the usual months at this latitude and elevation, and move with a warm or cold spring.
Piedmont Lake is a reservoir in Harrison County, Ohio. Lake by Lake tracks its level from the U.S. Geological Survey and compares it with full pool and the readings of the past year.
Salt Fork Lodge and State Park are near this 2,312-acre lake. Golden Age and Golden Access and other Federal recreation passports are not honored by the state.
Activities listed by the U.S. Army Corps of Engineers: Wildlife viewing
Piedmont Dam is an earthfill dam 56 feet high and 1,750 feet long on Stillwater Creek, completed in 1937. It belongs to the U.S. Army Corps of Engineers (Huntington District) and is run for flood control, fish and wildlife and recreation. At its normal level the reservoir holds 34,500 acre-ft, drained from 86 square miles of land.
From the National Inventory of Dams (U.S. Army Corps of Engineers), NID ID OH00011. Lake or reservoir: what’s the difference?
Where the level comes from: Piedmont Lake at Piedmont OH (U.S. Geological Survey, used on this page) and Stillwater Creek at Piedmont Dam Pool (NOAA National Water Prediction Service).
| Lake | Miles | Level (ft) | vs full | 7 days |
|---|---|---|---|---|
| Clendening Lake At or near full pool | 6 | 897.71 | −0.29 | −0.22 |
| Tappan Lake At or near full pool | 11 | 898.64 | −0.66 | −0.29 |
| Leesville Lake Slightly below full | 19 | 960.68 | −2.32 | −1.10 |
| Senecaville Lake At or near full pool | 22 | 832.57 | +0.37 | −0.18 |
| Atwood Lake At or near full pool | 23 | 926.33 | −1.67 | −1.02 |
| Dover Lake Live reading | 27 | 865.91 | — | +0.20 |
Compare Piedmont Lake with Clendening Lake, Tappan Lake, Leesville Lake or Senecaville Lake: size, level, ramps and fish side by side.
Piedmont Lake is at 911.03 feet above sea level — 1.97 ft below full summer pool, as of Nov 19, 2026, 1:15 AM EST. It has dropped 0.88 ft in the past 7 days.
Piedmont Lake's full summer pool is 913.00 ft, according to U.S. Army Corps of Engineers. Today the lake is 1.97 ft below that mark.
Today's level is 0.57 ft above the median for this date (910.46 ft), from the gauge’s long-term daily record.
904.89 ft, on February 2, 2026, in the U.S. Geological Survey record, which starts in 2017. Today the lake is 6.1 ft above that.
919.86 ft, on April 14, 2024, in the U.S. Geological Survey record since 2017. That is 6.9 ft above full summer pool.
Piedmont Lake has 4 boat ramps on our map, including Boat ramp at Piedmont Marina, and 2 marinas. Low water can close ramps, so check today's level above and the operator before you go.
Yes. There are 2 campgrounds and RV parks within about a mile of the shore, such as Camp Piedmont 4 H, Camp Presmont.
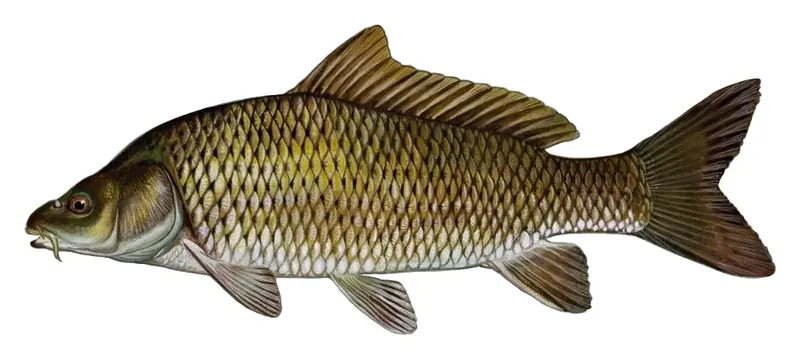
Game fish recorded in Piedmont Lake include common carp. In all, 8 fish species have open records inside the lake on GBIF.
Anglers 16 and older need an Ohio fishing license, sold online by the Ohio Department of Natural Resources Division of Wildlife. Free fishing days: Father's Day weekend. Size and bag limits can be set lake by lake: check the current regulations.
Piedmont Lake averages about 15 ft deep. Depth changes with the lake level.
Yes: fishing map with depth contours from the Ohio Department of Natural Resources, Division of Wildlife. It is linked in the lake facts on this page. Depths on a map are measured at a reference level: subtract how far the lake is below it today.
U.S. Army Corps of Engineers lists wildlife viewing at Piedmont Lake.
EPA's CyAN satellite rated cyanobacteria in Piedmont Lake moderate on November 9. The satellite sees open water only; blooms can be patchy, so avoid water that looks like spilled paint or pea soup and keep dogs out of scum. Swimming advisories come from Ohio health and environment agencies.
Yes. 2 trails run along or near the shore, including Buckeye Trail (Bowerston) and North Country National Scenic Trail (OH), according to OpenStreetMap.
Piedmont Lake is held back by Piedmont Dam, completed in 1937 and 56 ft high, according to the National Inventory of Dams.
From the U.S. Geological Survey (Piedmont Lake at Piedmont OH). Lake by Lake checks it every hour; the agency's own figure is always the reference, and provisional readings can be revised.
Lake levels are refreshed every hour. Texas and California reservoirs report once a day; most USGS and NOAA gauges report every 15 to 60 minutes.
Cookies for analytics With your OK we use Google Analytics and Microsoft Clarity to count visits and see how the site is used, so we can make it better. No advertising cookies. Privacy policy